What if I told you you can take any TradingView indicator, give it to an AI, and get back a fully backtestable strategy — without writing a single line of code?
That's exactly what I did. And the results surprised me.
What I Did
The process was simpler than I expected:
- Found a Bollinger Bands indicator on TradingView — I spotted a popular public indicator with nice visuals
- Copied the Pine Script code — Just Ctrl+C from TradingView's indicator settings
- Sent it to my AI assistant (OpenClaw) — Asked it to convert the indicator into a strategy with entry/exit rules
- Got back a complete Pine Script strategy — Ready to paste into TradingView
- Ran the backtest — Saw real performance numbers in minutes
The key was giving the AI clear instructions on how to convert the indicator's visual signals into concrete trading rules:
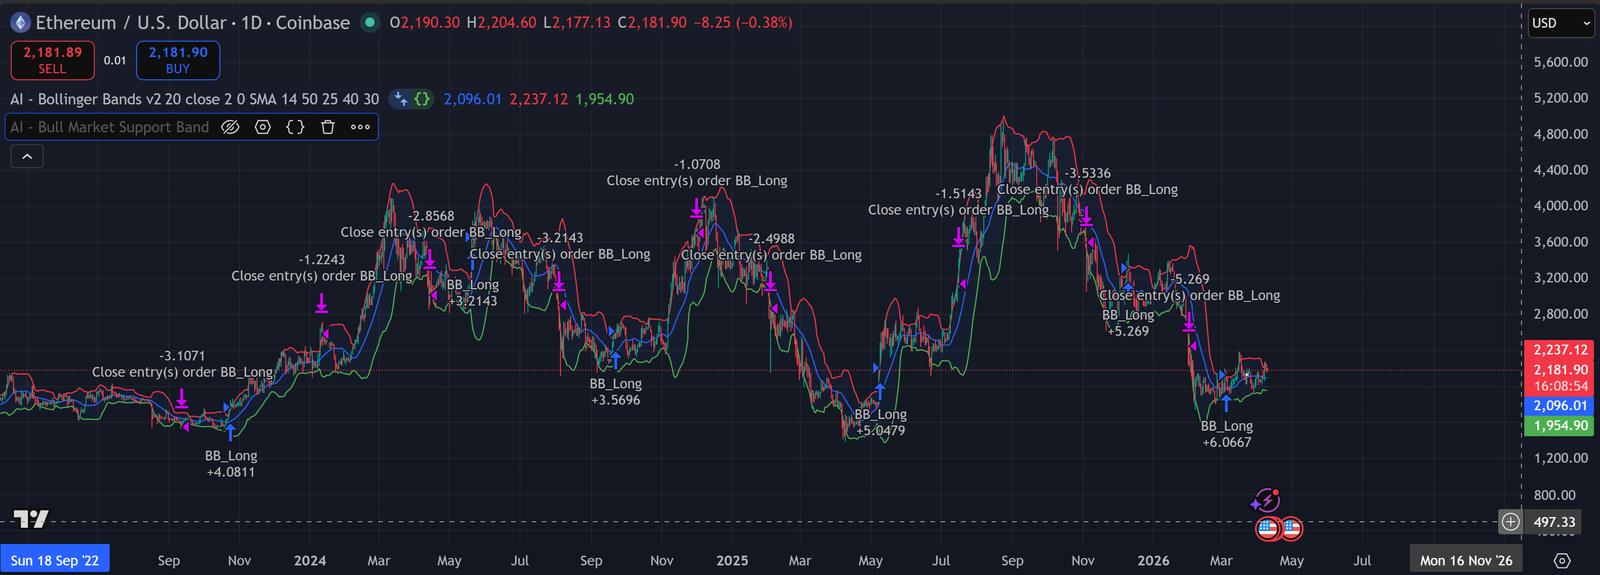
- When price crosses above the upper Bollinger Band → Long entry
- When price crosses below the lower Bollinger Band → Short entry
- Exit rules based on mean reversion logic
Why This Matters — The Benefits
No Coding Knowledge Required
Traditionally, turning an indicator into a strategy requires learning Pine Script. With AI, anyone can do it. You just need to:
- Know how to read an indicator visually
- Understand when the indicator gives buy/sell signals
- Ask AI to write the strategy code
Backtest Without Coding
Once you have the strategy code, you can:
- Test it on historical data in TradingView
- See exactly how the strategy would have performed
- Optimize parameters without hiring a developer
- Validate your trading ideas before risking real money
Speed & Iteration
In 20 minutes, I:
- Found an indicator
- Got an AI to convert it
- Backtested it on ETH/USDT
- Had real numbers to evaluate the strategy
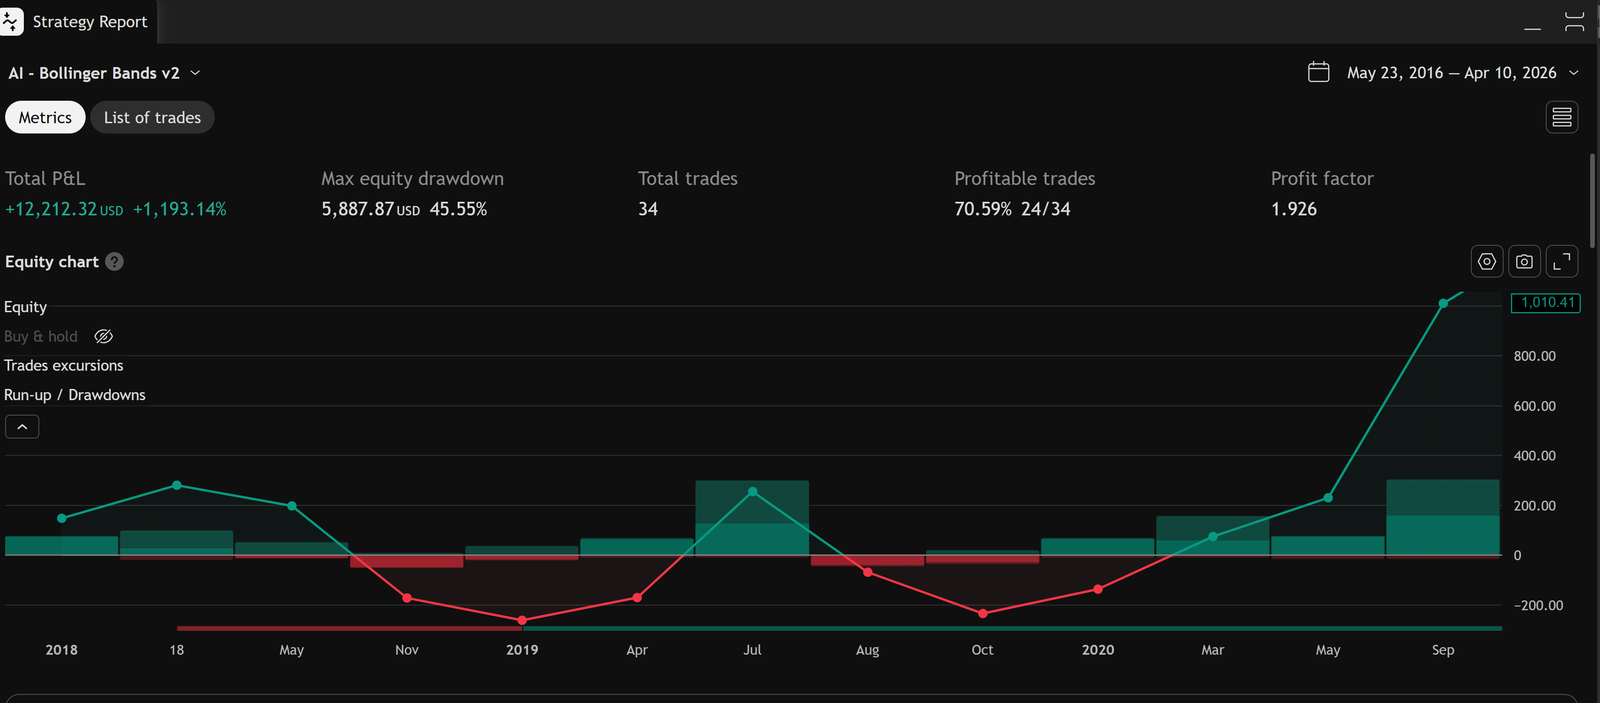
The Backtest Results
Here's what the AI-generated Bollinger Bands strategy produced on ETH/USDT (1H timeframe):
Strategy vs Buy & Hold Benchmark
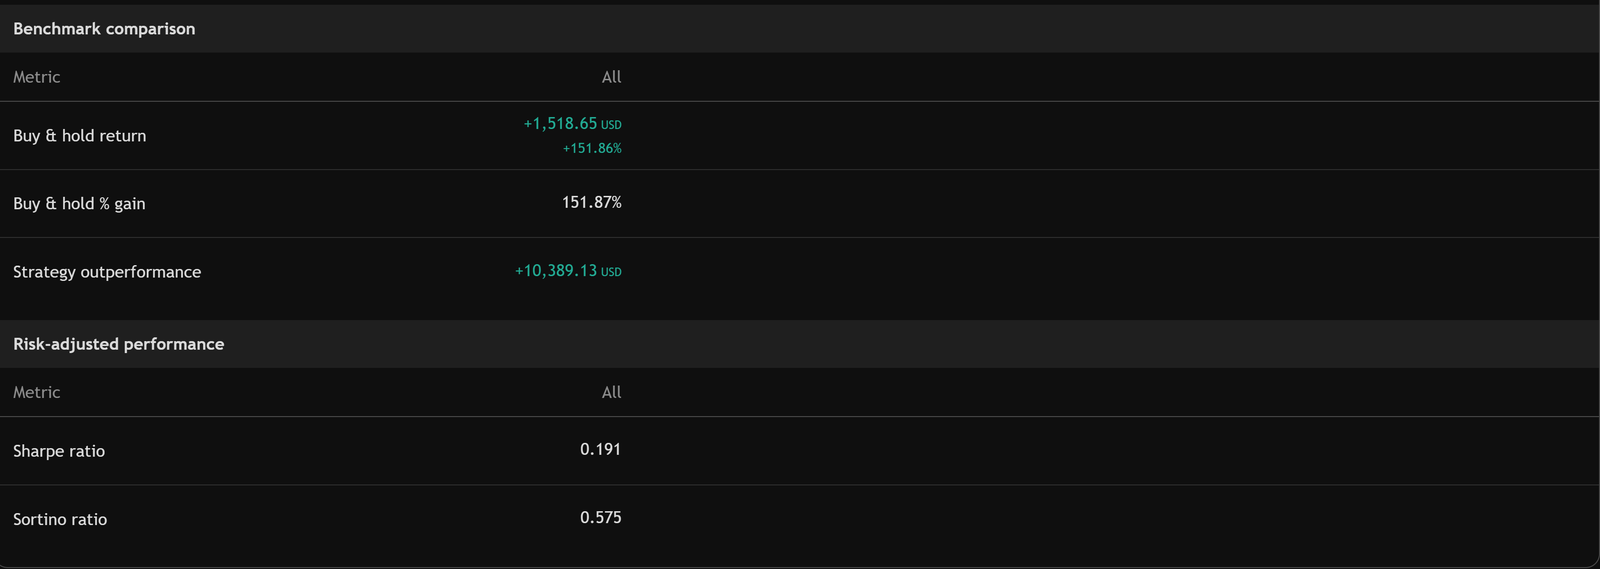
Key Metrics Breakdown
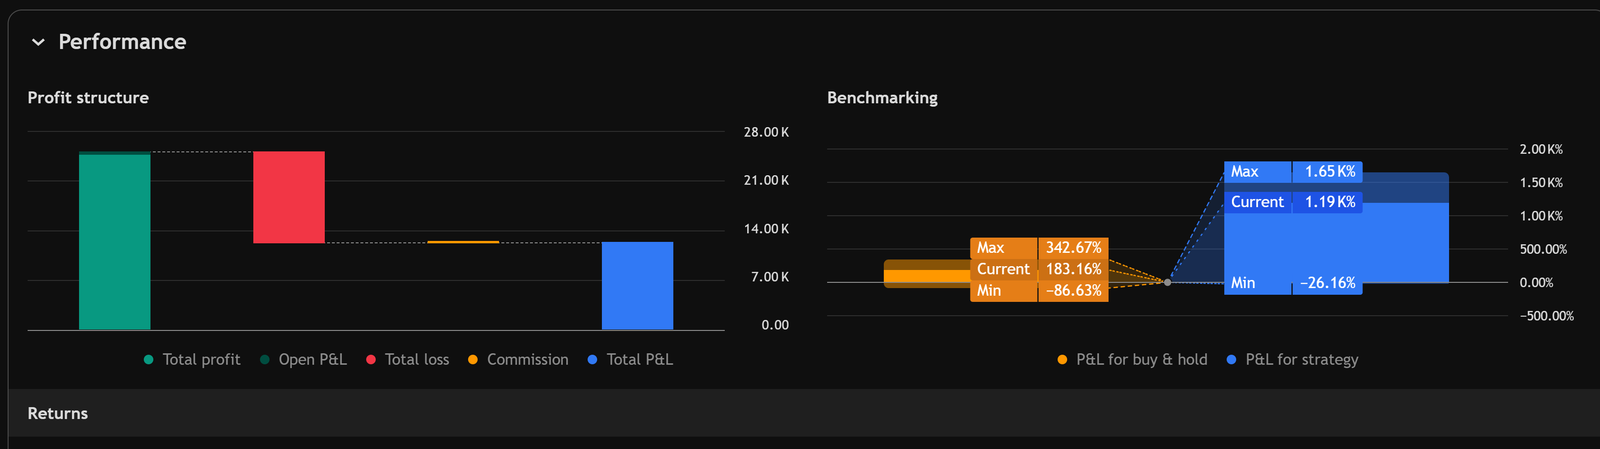
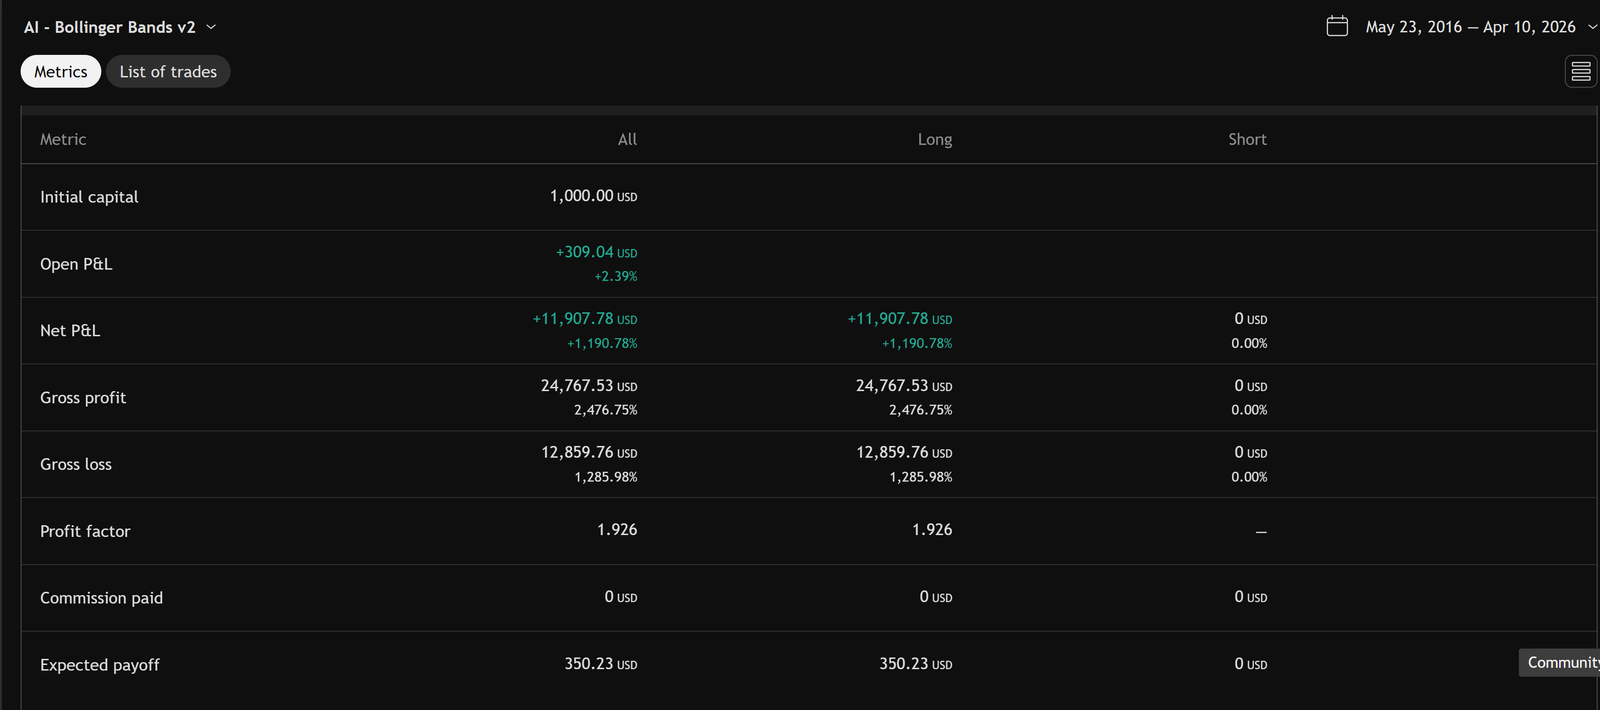
| Net Profit | 1,190.78% |
| Buy & Hold Benchmark | 151.9% |
| Win Rate | 70.59% |
| Profit Factor | 1.926 |
| Max Drawdown | -45.55% |
What These Numbers Mean
- Net Profit 1,190.78% — The strategy multiplied the account by ~12x
- Outperformed Buy & Hold by 1,038.88% — Massive alpha generation vs passive holding
- Profit Factor 1.926 — For every $1 lost, we made $1.93. Above 1.5 is solid
- Max Drawdown -45.55% — The worst peak-to-trough decline. Higher risk but manageable for the returns achieved
- 70.59% Win Rate — Nearly 3 out of 4 trades are winners
Key Takeaways
- AI lowers the barrier to entry — You don't need to learn Pine Script to backtest strategies
- Massive outperformance — 1,190.78% vs 151.9% Buy & Hold = +1,038.88% more returns
- Validate before risking capital — Backtesting won't guarantee future results, but it filters bad strategies
- Speed matters — What used to take days now takes minutes with AI
What's Next?
I'm now exploring:
- Testing on other assets (BTC, SOL, altcoins)
- Optimizing the Bollinger Band parameters
- Adding stop-loss and take-profit rules
- Combining with other indicators for confirmation
Have you tried using AI to generate trading strategies? Drop a comment below — I'd love to hear what worked for you!
Back to Blog